Visualising Your IoT Data
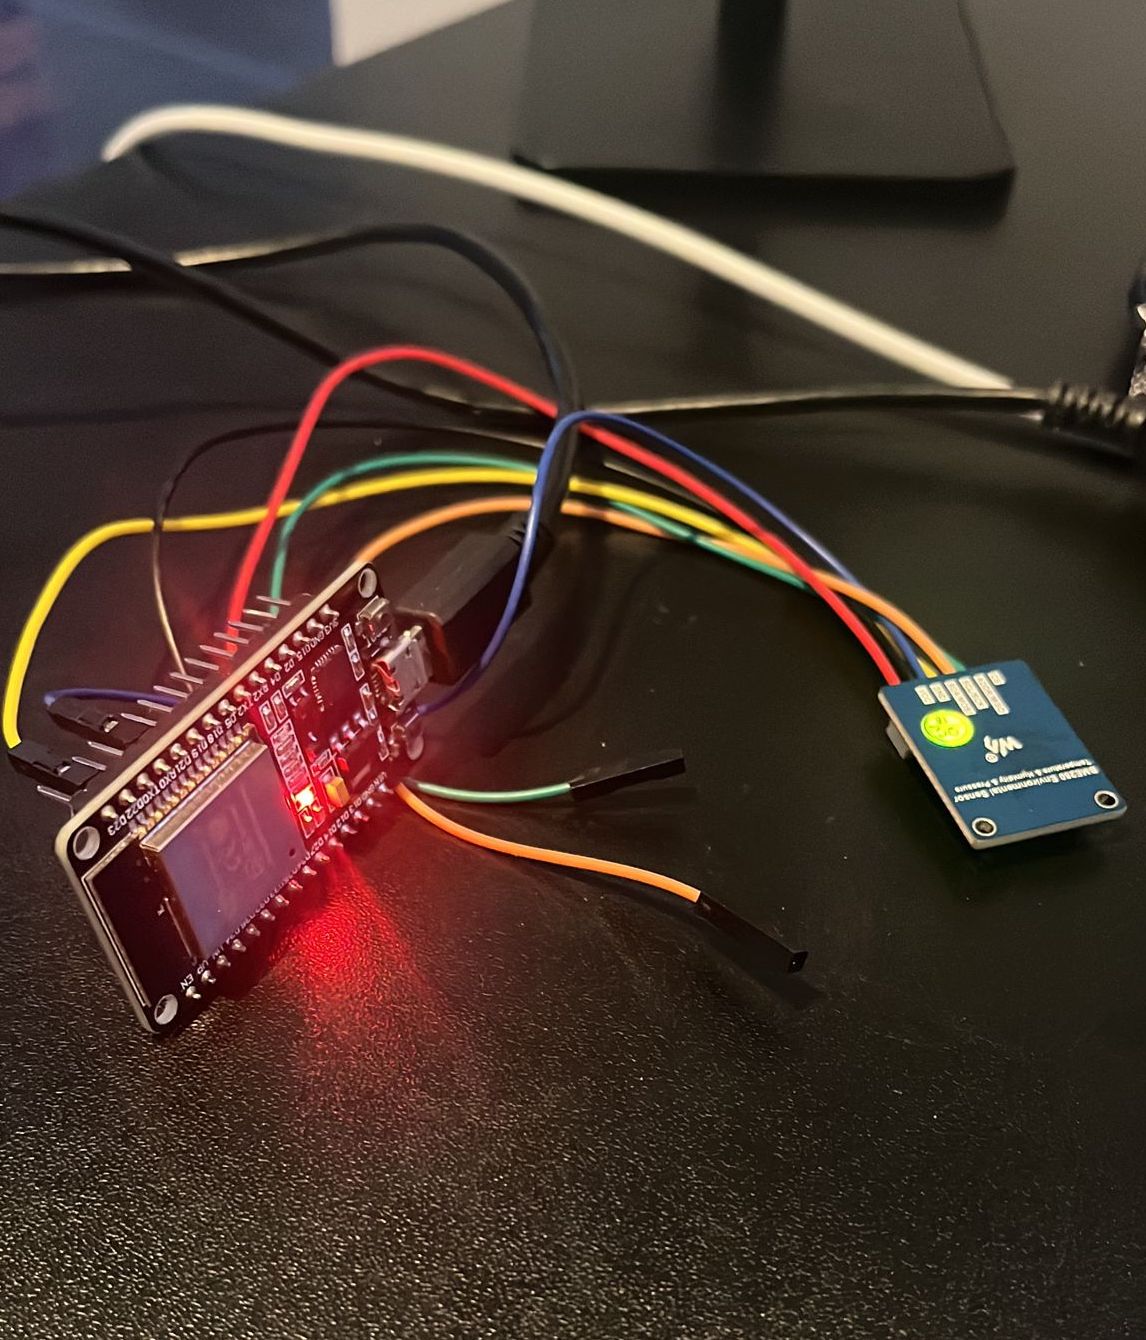
Recently, I’ve learned a lot about the Internet of Things (IoT) and I just gotta share some of the cool stuff I’ve found. I’m using the ESP32 module to gather data from a temperature sensor and humidity sensor. I’ve used the Arduino IDE before, but I’ve never really used it for anything serious. I’ve always used it for small projects like blinking LEDs. In one of our projects, we wanted to use this module as a sensor agent. It’s really easy to use, cheap, and cost-effective. Its performance is great, and the best thing is that it has WiFi and Bluetooth. If you’re interested in more info, you can check out their website.
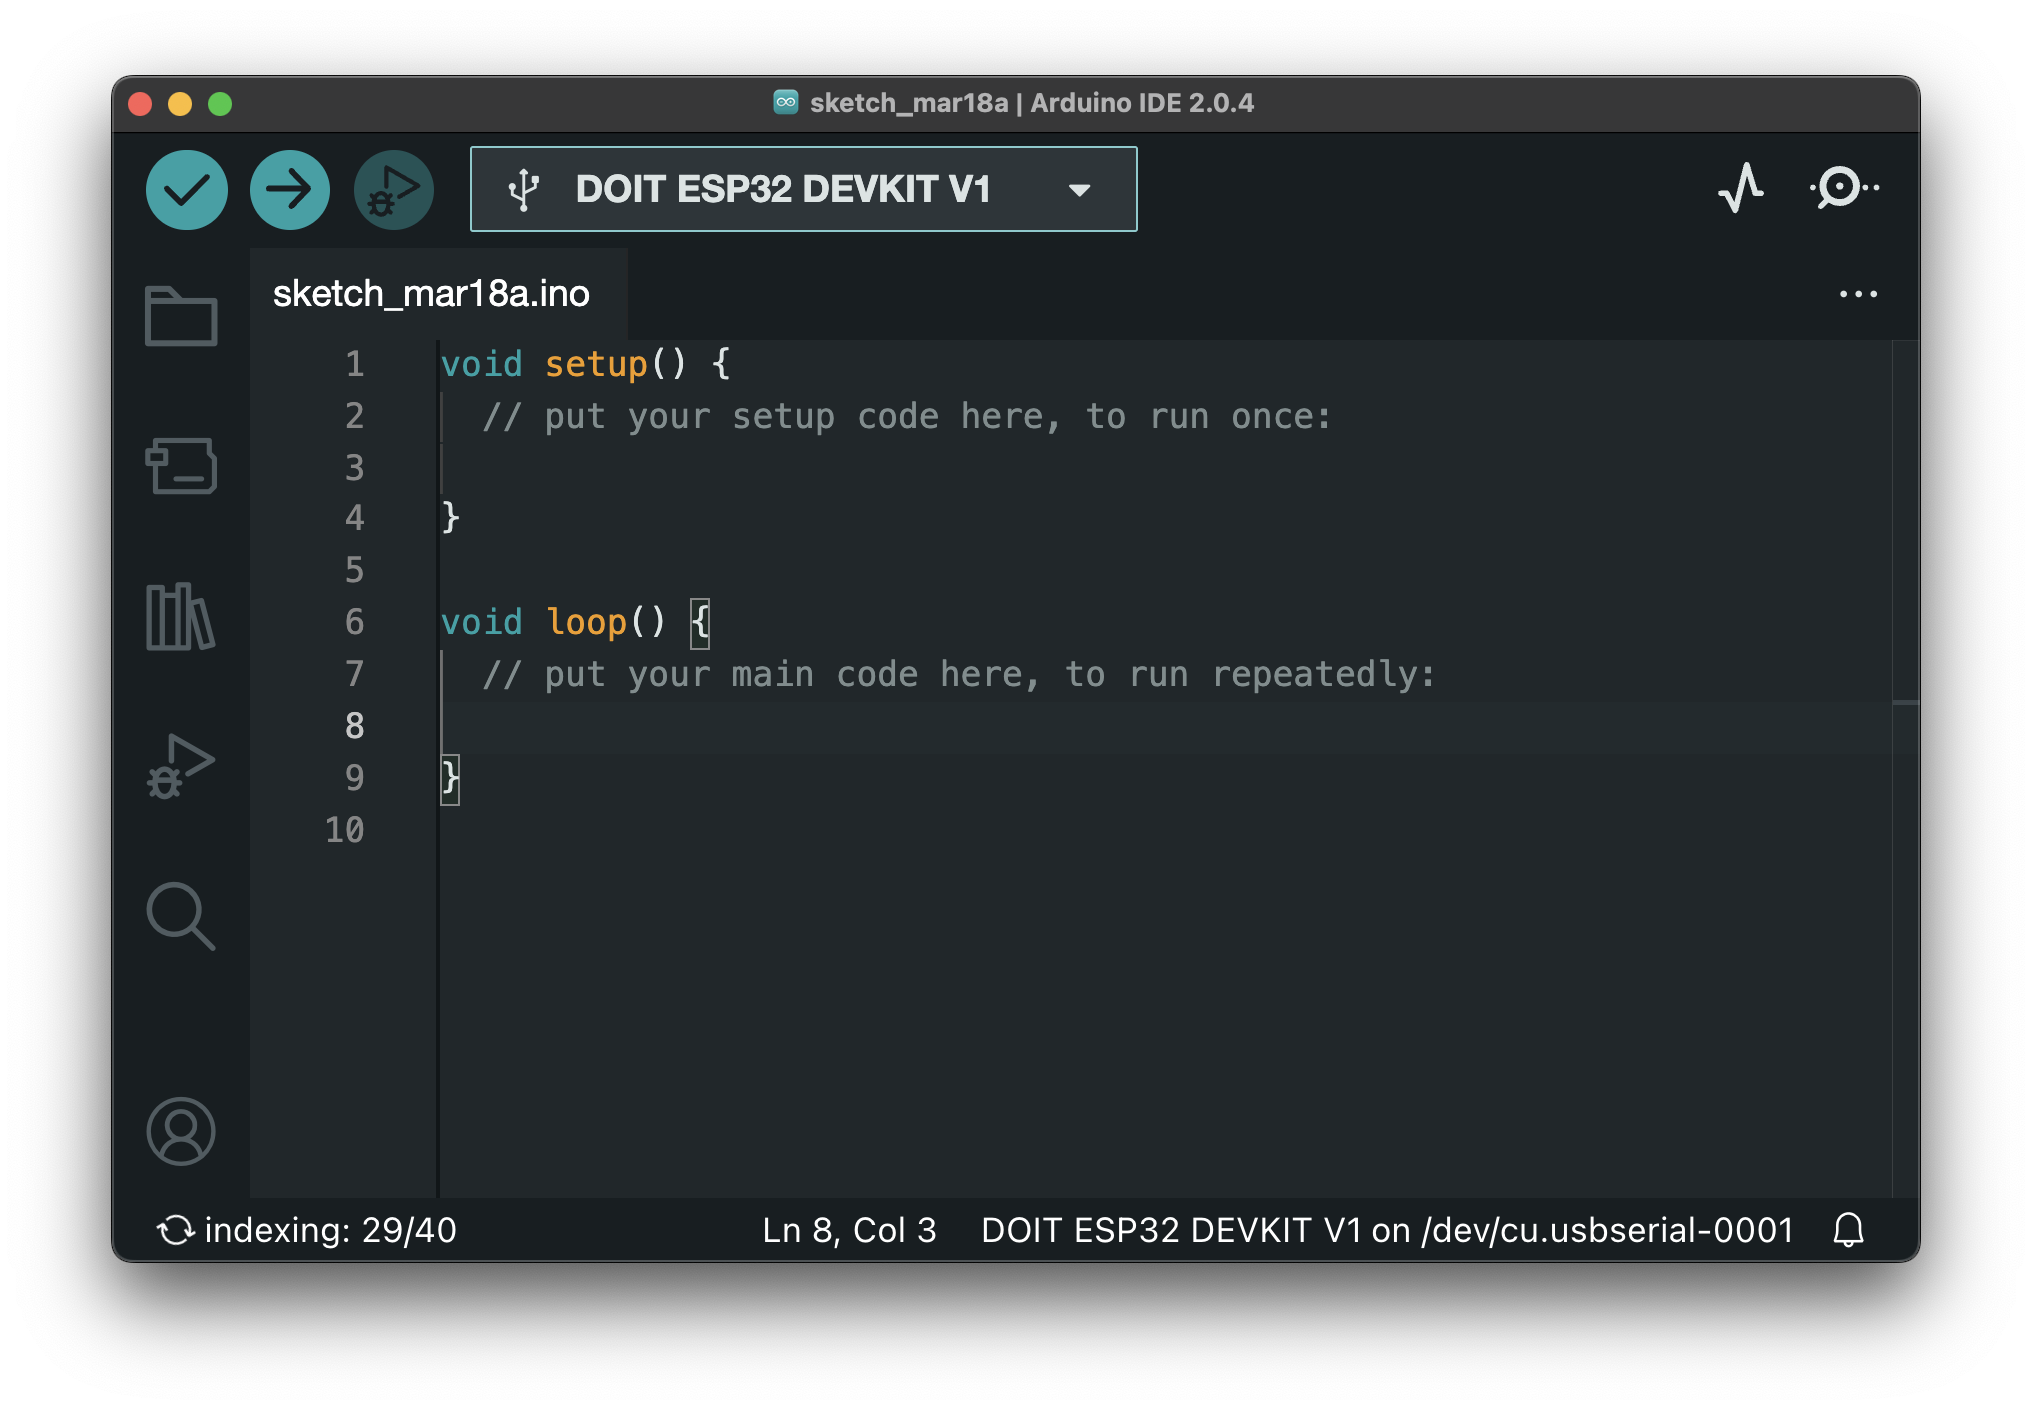
There are numerous options available for coding this module, including Platform.io and Arduino. For those familiar with C#, you can even use nanoFramework for .NET. Personally, I found the Ardunio much easier to use and I got started with it in no time.
Getting sensor data is easy, just plug the sensor in and upload this code:
#include <Wire.h>
#include <Adafruit_BME280.h>
#include <WiFi.h>
#include <HTTPClient.h>

const char* ssid = "...";
const char* password = "...";
#define INFLUXDB_TOKEN "..."
#define INFLUX_URL "http://192.168.10.98:8086/api/v2/write?org=ORG_NAME&bucket=BUCKET_NAME"

WiFiClient espClient;
Adafruit_BME280 bme;
HTTPClient http;

void setup() {
  Serial.begin(115200);
  WiFi.begin(ssid, password);
  Serial.print("Connecting");
  while (WiFi.status() != WL_CONNECTED) {
    delay(500);
    Serial.print(".");
  }
  Serial.print("Connected");
  Serial.println();
  Serial.print("Connected, IP address: ");
  Serial.println(WiFi.localIP());
  Wire.begin();
  bme.begin(0x77);
}

void loop() {
  String temperature = String(bme.readTemperature());
  String humidity = String(bme.readHumidity());
  String postData = "esp32bme28 temperature=" + temperature + "\n";
  postData += "esp32bme28 humidity=" + humidity;
  http.begin(INFLUX_URL);
  http.addHeader("Authorization", "Token " + String(INFLUXDB_TOKEN));
  int httpCode = http.POST(postData);
  Serial.println(httpCode);
  http.end();
  delay(1000);
}
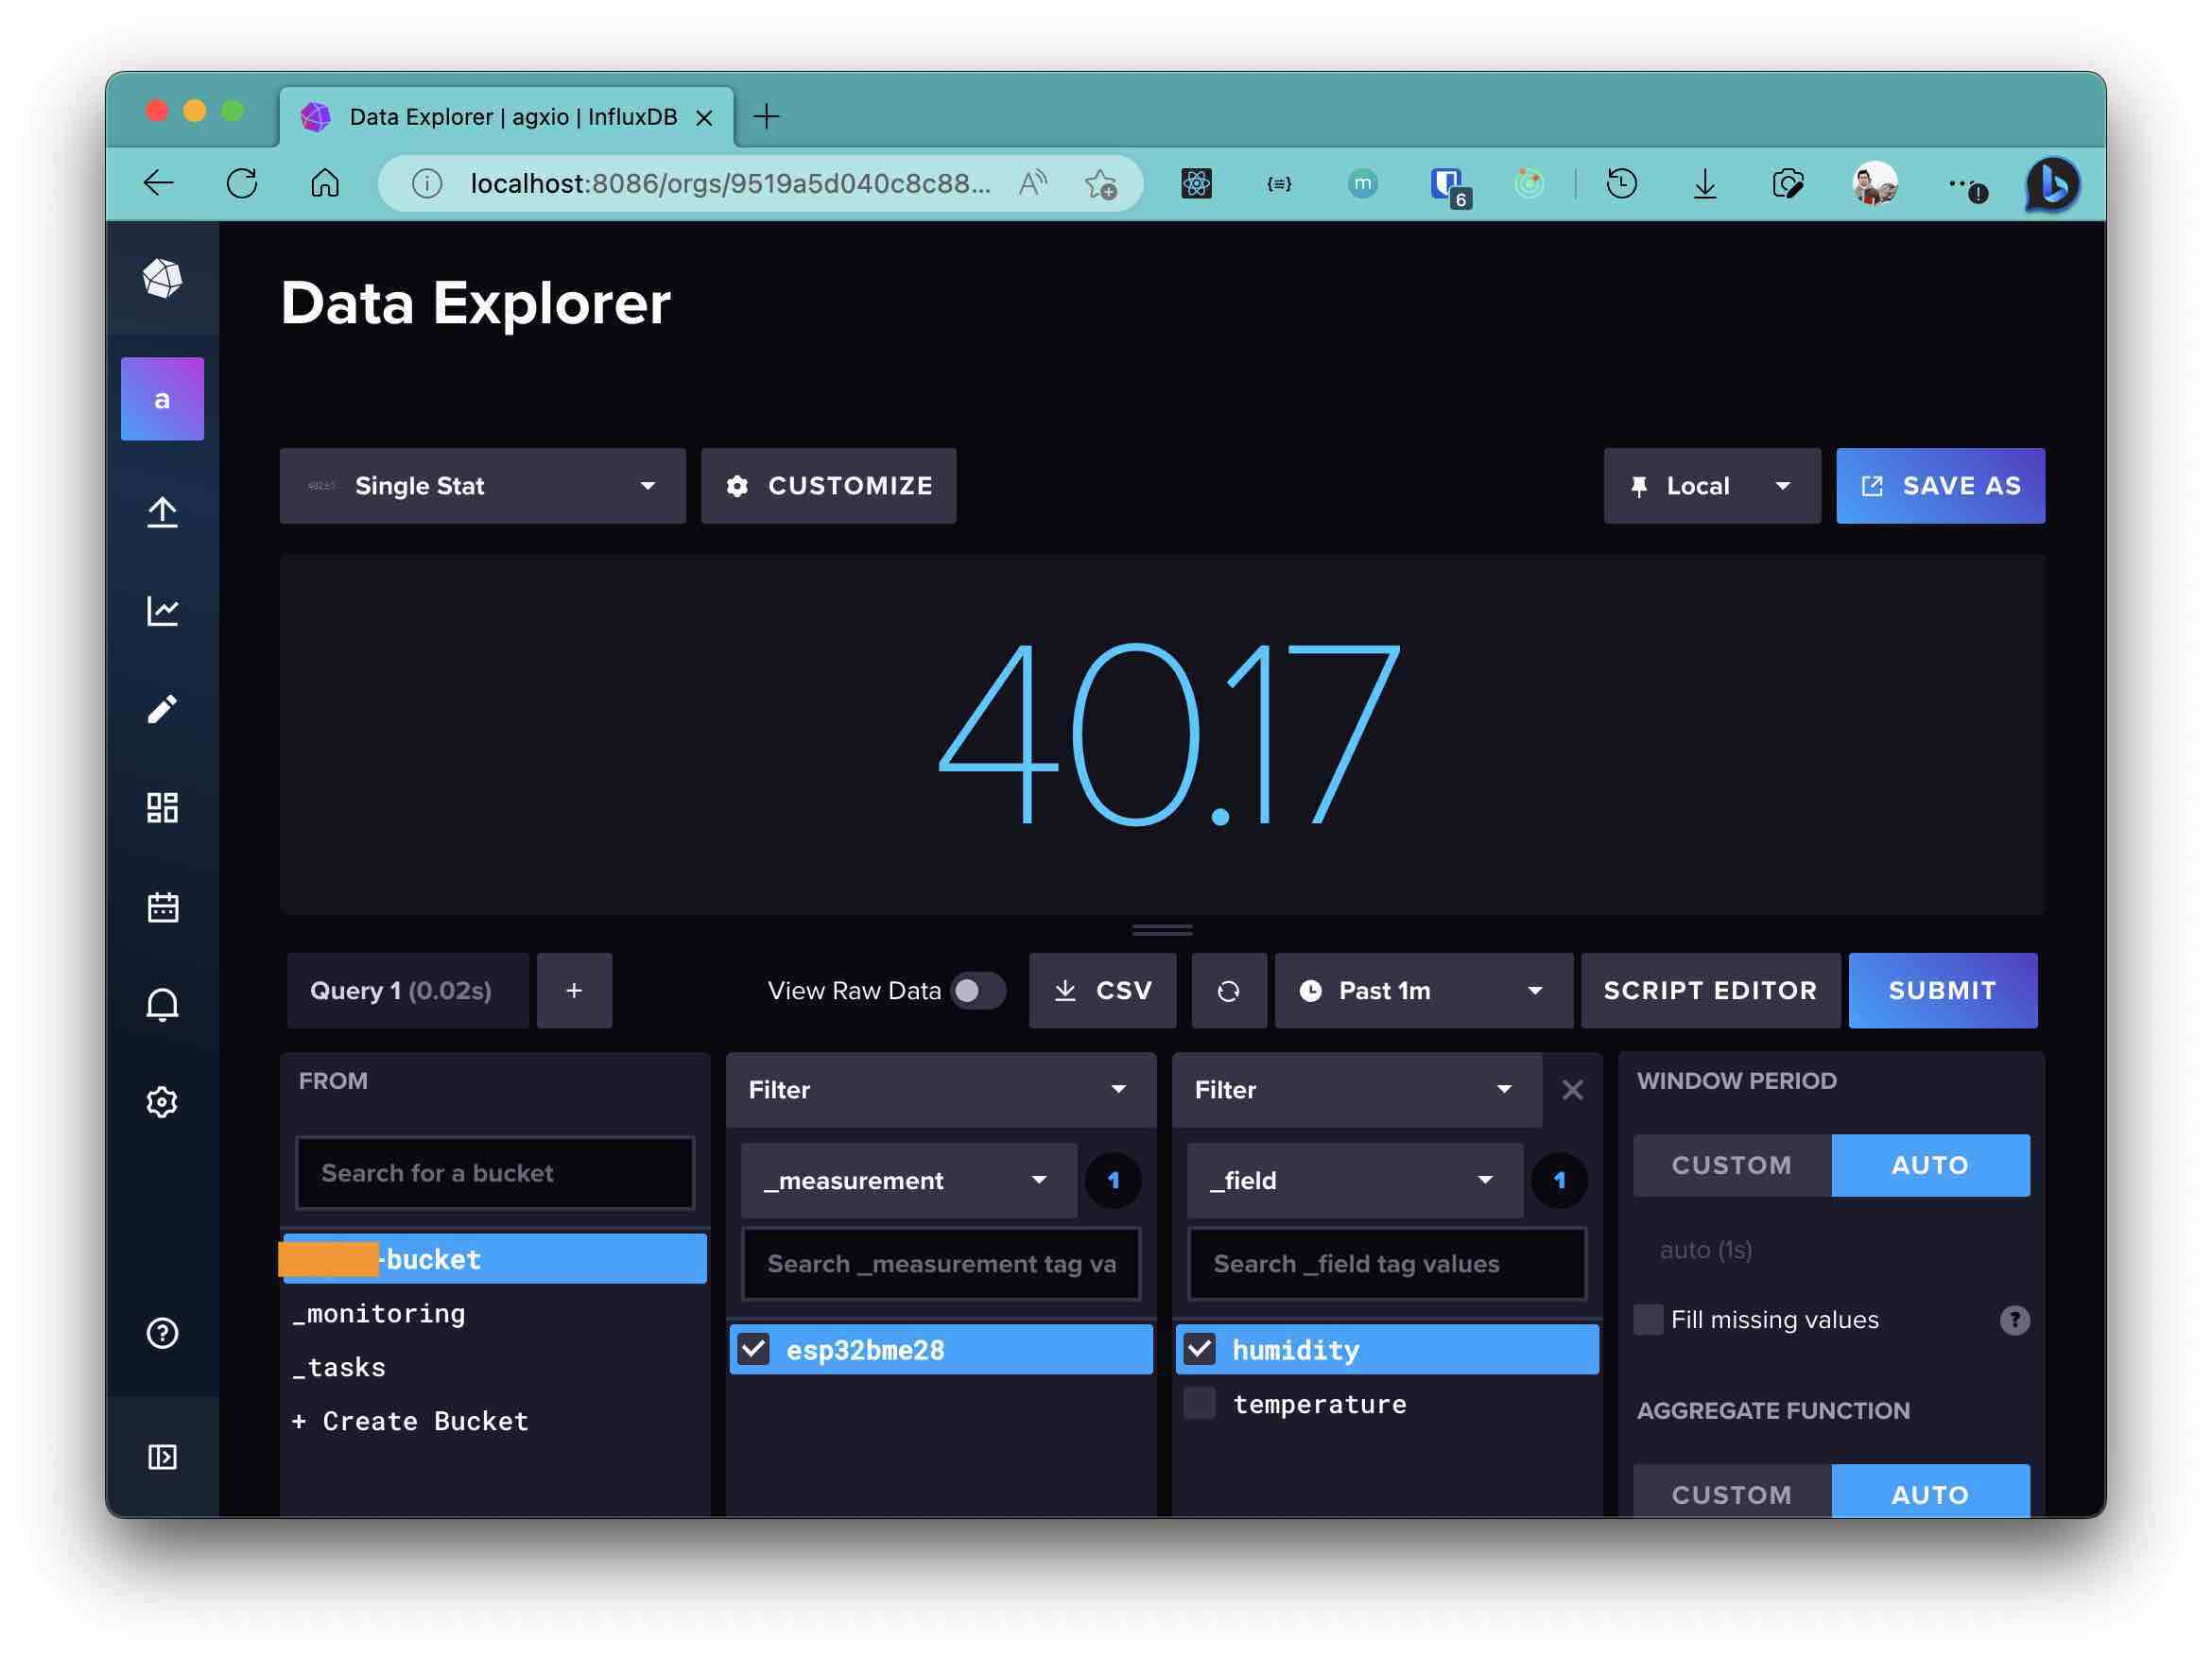
In the code, we start by including the required libraries like Wire.h for I2C communication, Adafruit_BME280.h for Wi-Fi communication, and HTTPClient.h for HTTP communication with InfluxDB. After the we have defined the constants for the Wi-Fi and InfluxDB. Next, we initialize the Wi-Fi and the BME280 sensor within the setup() function. Then, in the loop() function, we send the temperature and humidity to InfluxDB. The data is sent using the Line Protocol every second.
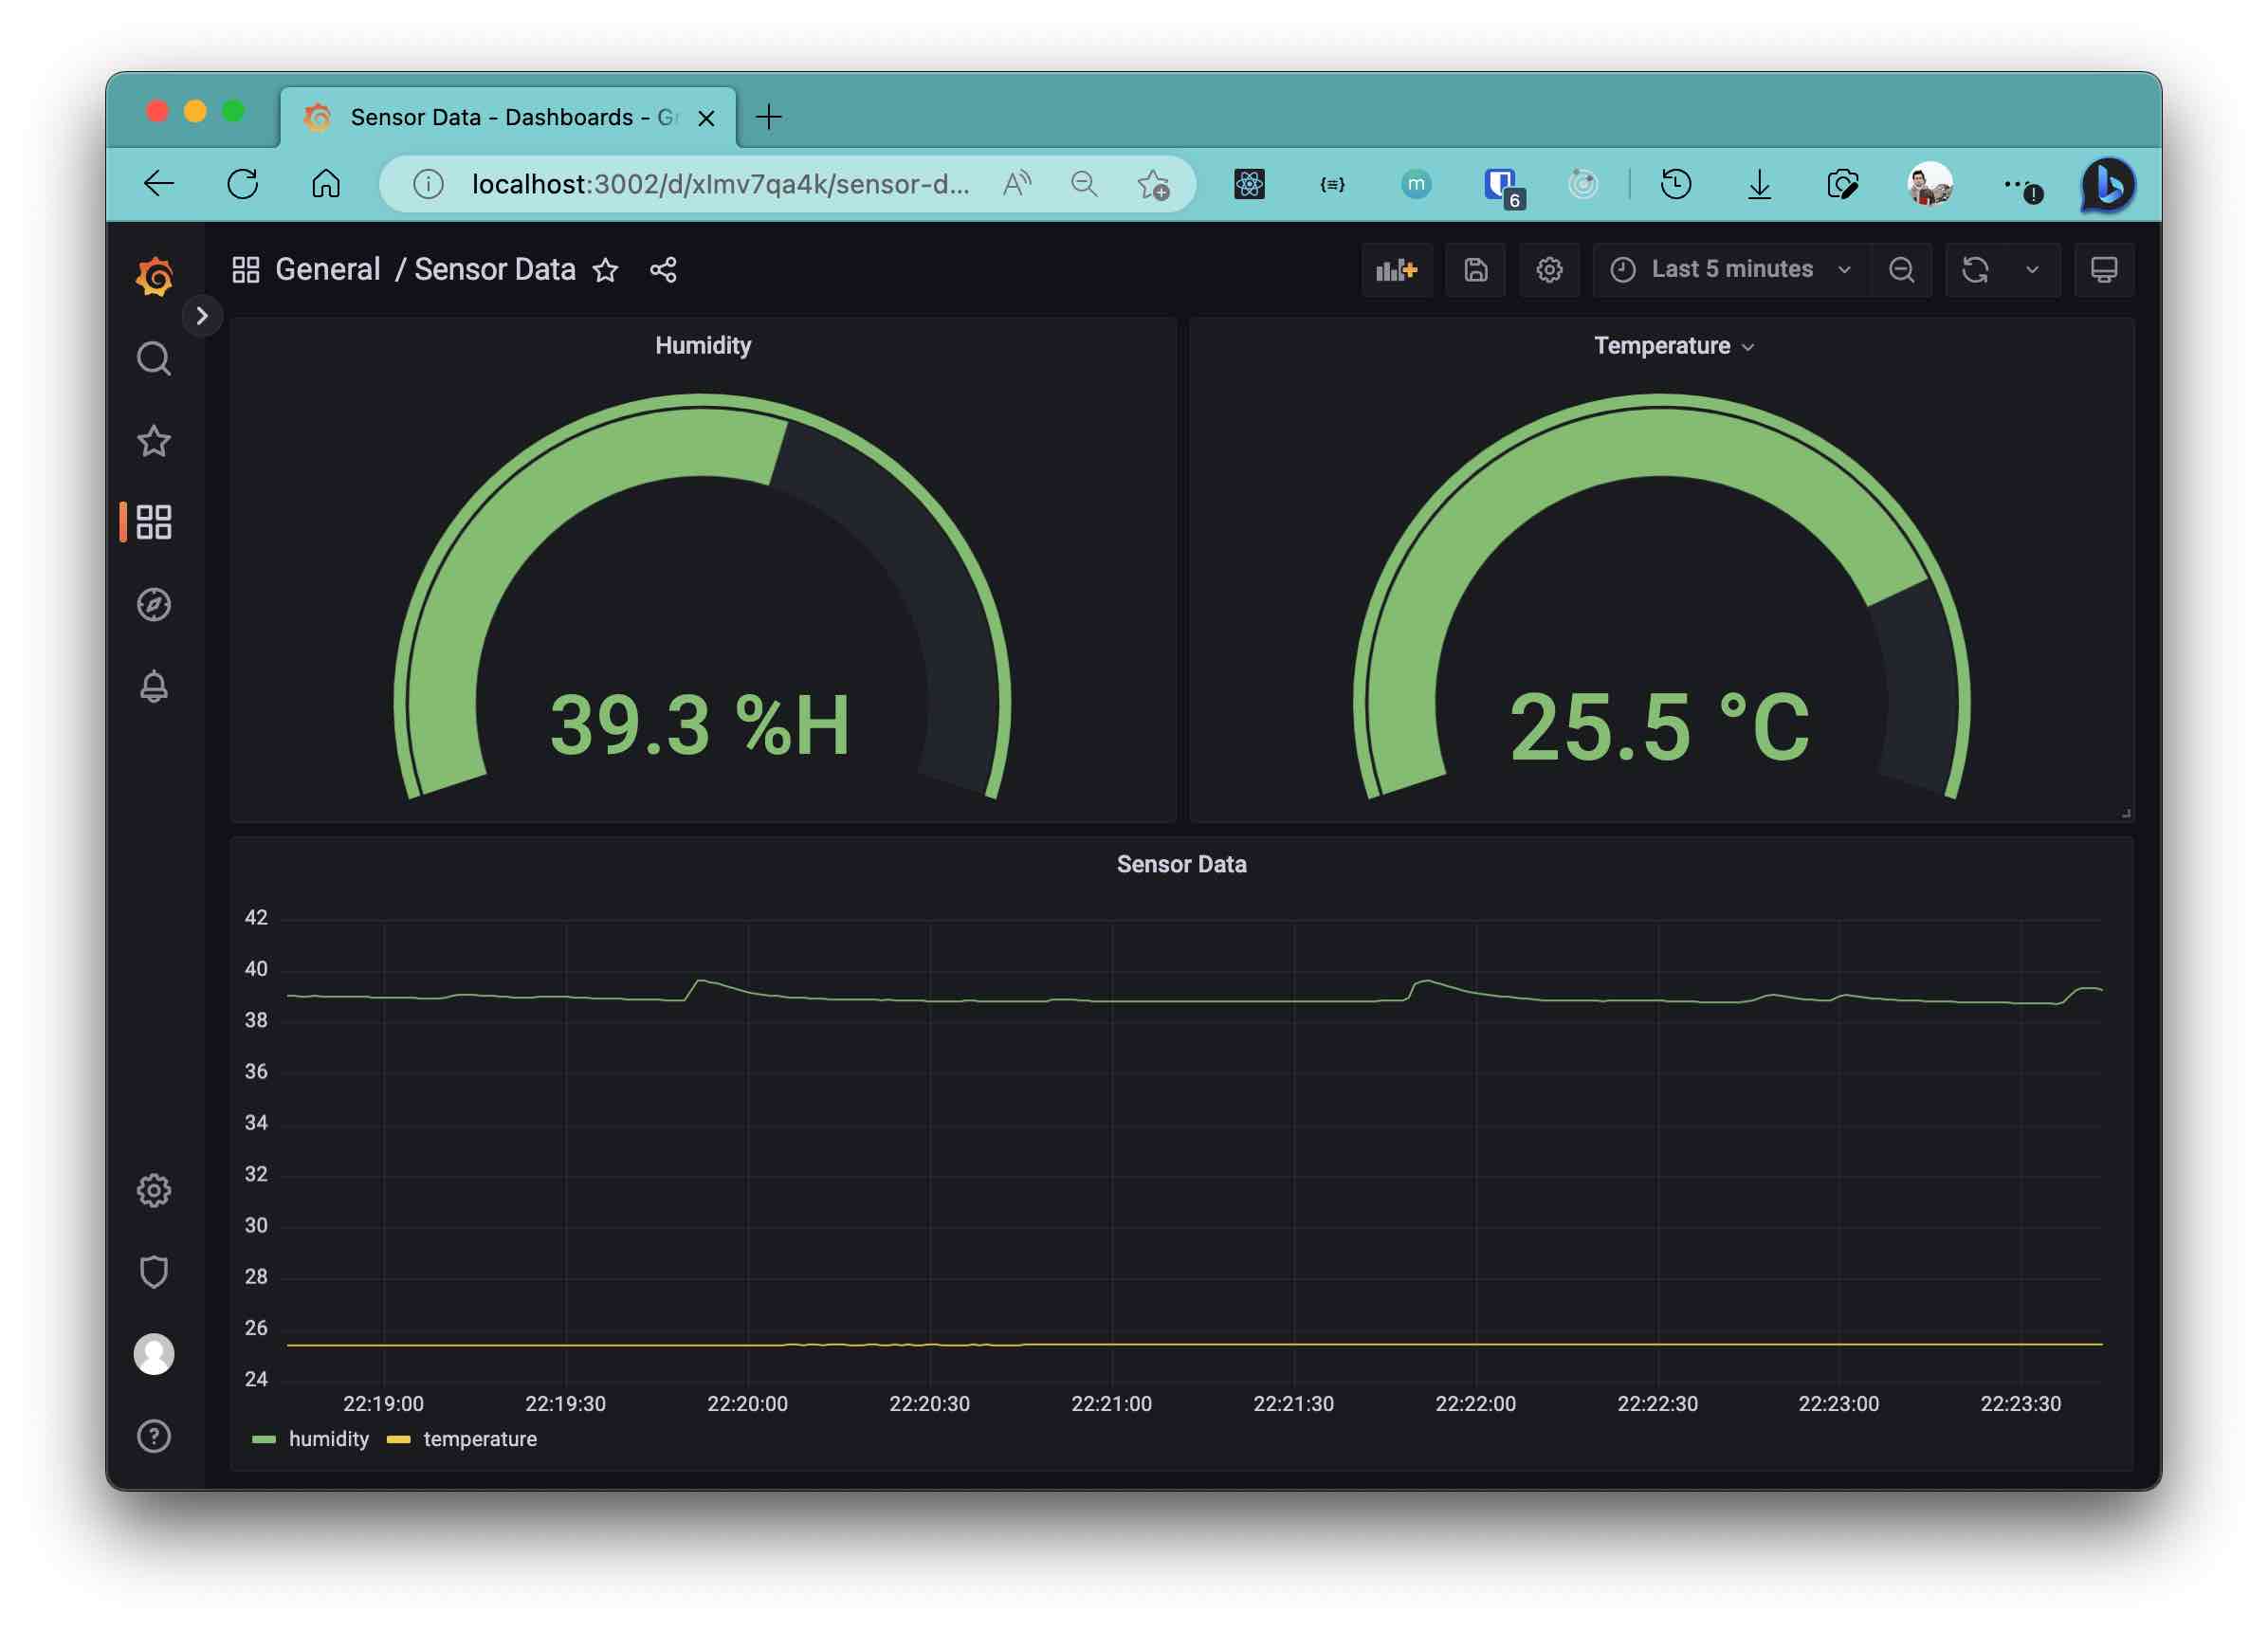
Now that we have the data in InfluxDB, we can visualise it using Grafana. Grafana is a great tool for visualising data. It’s easy to use and has a lot of features. It’s also free and open-source: